papaya2 is a small header-only C++ library for computing irreducible 2D Minkowski tensors of image and polygonal data. The library needs a C++ 11 compliant compiler, and no external dependencies. Papaya2 is meant for routine data analysis. For exploring small 2D datasets, have a look at the morphometer! If you want to compute Cartesian Minkowski Tensors, take a look at papaya1, as those are currently unsupported by papaya2.
The distribution contains a few small sample programs which perform different kinds of data analysis:
- ppanalysis – pointpattern analysis
- imganalysis – image analysis of PNG files
- banana – analysis of FITS files
- sersic – image analysis of arbitrary functions
These programs are meant to be simple, and to be adaptable to your purposes by modification.
The download contains as well bindings to other programming languages:
- pypaya2 – a Python module for doing pointpattern and image analysis
- Two Matlab extensions for doing image and pointpattern analysis
- papaya2.js – a javascript binding for including papaya2 in web applications
Download:
The source code can be found on Github: papaya2.
Alternatively, you can download git master as a ZIP archive.
Papaya2 was written by Sebastian Kapfer, Jenny Wagner and Fabian Schaller.
If you’re using this work in published research, please cite
Schaller et al., (2020). papaya2: 2D Irreducible Minkowski Tensor computation. Journal of Open Source Software, 5(54), 2538.
Papaya2 is licensed under the Boost License, except for the file picopng.hpp, which is a copy of PicoPNG. It also includes a copy of Catch2 for unit testing.
C++ library
The C++ 11 library papaya2 contains the core algorithms to compute irreducible Minkowski tensors of two-dimensional geometries. It processes both polygonal and 2D image input data. papaya2 is a header-only template library designed to operate on user data structures. The source code of the bundled command-line utilities contains some usage examples.
The main components of the library are defined in the header file <papaya2/papaya2.hpp>. Analysis results are returned in a MinkowskiAccumulator object, which offers accessors to retrieve common morphometric data, including the following:
area()The 2D volume (area) enclosed by the geometryperimeter()The perimeter (boundary length) of the geometrymsm(s)The -th Minkowski structure metric
imt(s)The-th irreducible Minkowski tensor 
The core algorithms for computing Minkowski tensors are also defined in MinkowskiAccumulator. Usually, the user does not need to interact with those. Common analysis problems are exposed in wrapper functions at the top level of the papaya2 namespace. These functions are C++ function templates which operate on user data structures:
papaya2::imt_polygon(vertices): compute the irreducible Minkowski tensors of closed convex polygons.verticesis a C++ container with the vertex positions in counterclockwise order. (If given in clockwise order, the Minkowski tensors are those of a hole by the additivity property.)
The return value is aMinkowskiAccumulatorobject.papaya2::imt_interpolated_marching_squares(photo, threshold, flags): computes the irreducible Minkowski tensors of an excursion set of a single channel of a raster graphics image (bitmap). An extended version of the classic Marching Squares algorithm is used which computes interpolated contours from 2×2 neighborhoods.
photo, template parameter, is the input data. The datatype must support the operations listed here. There are several examples for such adapter classes in the code.
thresholdis the threshold used for segmentation.
flags, optional, can be a combination ofANALYZE_WHITE,ANALYZE_BLACK,CONNECT_WHITE,CONNECT_BLACK.
The return value is aMinkowskiAccumulatorobject.papaya2::minkowski_map_interpolated_marching_squares: implements the Minkowski map algorithm for a space-resolved anisotropy analysis.
The return value is aMinkowskiAccumulatorobject.
The supplementary header <papaya2/voronoi.hpp> implements the Minkowski Tensor analysis of point patterns via the Voronoi tessellation approach. The source code of ppanalysis exemplifies how to use this header file. For computing the Voronoi diagram, the CGAL library is required.
Demos
ppanalysis
ppanalysis performs a morphometric analysis of the Voronoi cells generated by a 2D point pattern.
Usage
Type make ppanalysis to build the program. ppanalysis needs the CGAL library to build Voronoi diagrams.
ppanalysis in input_filename out output_filename
(nonperiodic mode)
ppanalysis in input_filename out output_filename boxL box sidelength
(continues the point pattern with periodic boundary conditions)
Input file format
ppanalysis reads a simple ASCII file containing the seed point coordinates:
# comments

x1    y1

x2    y2

x3    y3

....
Output file format
ppanalysis writes an ASCII table containing the seed point coordinates,
and the IMTs for each Voronoi cell.
# IMTs of Voronoi cells of a point pattern

# seedx seedy area perimeter q2 q3 q4 q5 q6

x1    y1    area1 perimeter1 q2,1 q3,1 q4,1 q5,1 q6,1

x2    y2    area2 perimeter2 q2,2 q3,2 q4,2 q5,2 q6,2

x3    y3    area3 perimeter3 q2,3 q3,3 q4,3 q5,3 q6,3

....
imganalysis
Usage
Type make imganalysis to build the program.
imganalysis in input_filename.png out output_filename.dat
imganalysis in input_filename.png out output_filename.dat contours contours_filename.dat
Input file format
imganalysis reads a plain PNG file, and analyzes the red color channel only.
More advanced analysis requires adjustments to the code (which is pretty brief, so that should be easy).
Output file format
imganalysis writes an ASCII table containing IMTs of several thresholds of the image. Each line begins with the threshold value, followed by the enclosed area, the perimeter, and the IMTs.
# comments

threshold area perim q2 arg2 q3 arg3 q4 arg4 q5 arg5 q6 arg6 q7 arg7 q8 arg8

....
Here, the qs columns contain the Minkowski structure metrics, and the args columns contain the complex argument of .
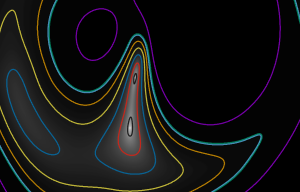
Optionally, it can also write out the isocontours that are constructed by the program for analysis. You can plot them in Gnuplot, for example, using the “with vectors” plotting style:
banana
banana can be used for analyzing astrophysics data in FITS format.
Usage
Type make banana to build the program. banana needs the CCfits library to read FITS files.
banana in input_filename.fits out output_filename [more options]
Options can be:
mask mask_filename.fits supply a mask for analyzing part of the image
mint lowest threshold
maxt largest threshold
numt number of thresholds to choose the thresholds for binarizing the image
Banana writes an ASCII table containing IMTs of several thresholds of the observation. Each line begins with the threshold value, followed by the enclosed area, the perimeter, and the IMTs.
# comments

threshold area perim q2 arg2 q3 arg3 q4 arg4 q5 arg5 q6 arg6 q7 arg7 q8 arg8

....
Here, the qs columns contain the Minkowski structure metrics, and the args columns contain the complex argument of .
sersic
The sersic example samples an elliptic Sérsic profile (defined in sersic.hpp) and computes IMTs for it.
Usage
Type make sersic to build the program. Example:
sersic scan_angle threshold t aspect a resolution res >output_filenamecreates a Sérsic profile with an aspect ratio a (0 < a < 1) in a square array of res pixel side length. Thresholding at t, the regular marching squares algorithm determines the IMTs  to
to  and arg(
 ) and writes all of these quantities to the file
 output_filename for each rotation angle of the Sérsic profile between 0 and π in steps of 0.02 π.
Alternative usage:
sersic scan_threshold aspect a resolution res >output_filenameyields the same IMTs as output but samples a threshold range from 1.1 to 2.71828 logarithmically-spaced into 30 sample thresholds at a fixed rotation angle of 0°.
Option:
The option interpolated_marching_squares can be added to use the interpolated marching squares algorithm for higher accuracy.
Bindings to other programming languages
pypaya2
Papaya comes with a Python2 module which can be used for analyzing pointpatterns quickly:
In [1]: import pypaya2

In [2]: imt = pypaya2.imt_for_pointpattern(a)

# output the psi2 for the first three Voronoi cells

In [3]: imt['psi2'][:3]
Out[3]: array([ 0.05116231+0.00505045j, -0.01378112-0.00431184j,
0.02915654-0.0727168j , -0.07049936+0.04529508j,
-0.04246323-0.02388724j, -2.00074429-0.08287061j])Image data can also be analyzed.
See README.md for installation instructions.
Matlab exensions
Papaya2 comes with two Matlab extensions for doing image and pointpattern analysis,
see the folder “matlab” in the Papaya2 download, and the example Matlab scripts there.
papaya2.js
Papaya2 comes with a JavaScript extension for image and pointpattern analysis, see the folder “javascript” in the Papaya2 download. papaya2.js is used in the morphometer for the IMT analysis.
papaya2.js needs emscripten for compiling.