Many applications for Minkowski functionals to gray-scale images can be found in astronomical imagery obtained from observations of ground-based and space-based telescopes.
- Example 1 shows the usage of an anisotropy analysis to classify astronomical objects
- Example 2 shows the usage of a Minkowski structure metrics analysis to characterise galaxy intensity profiles
- Example 3 shows the usage of Minkowski Vectors to characterise local properties of gravitational lenses
Example 1: Classification of astronomical objects by an anisotropy analysis
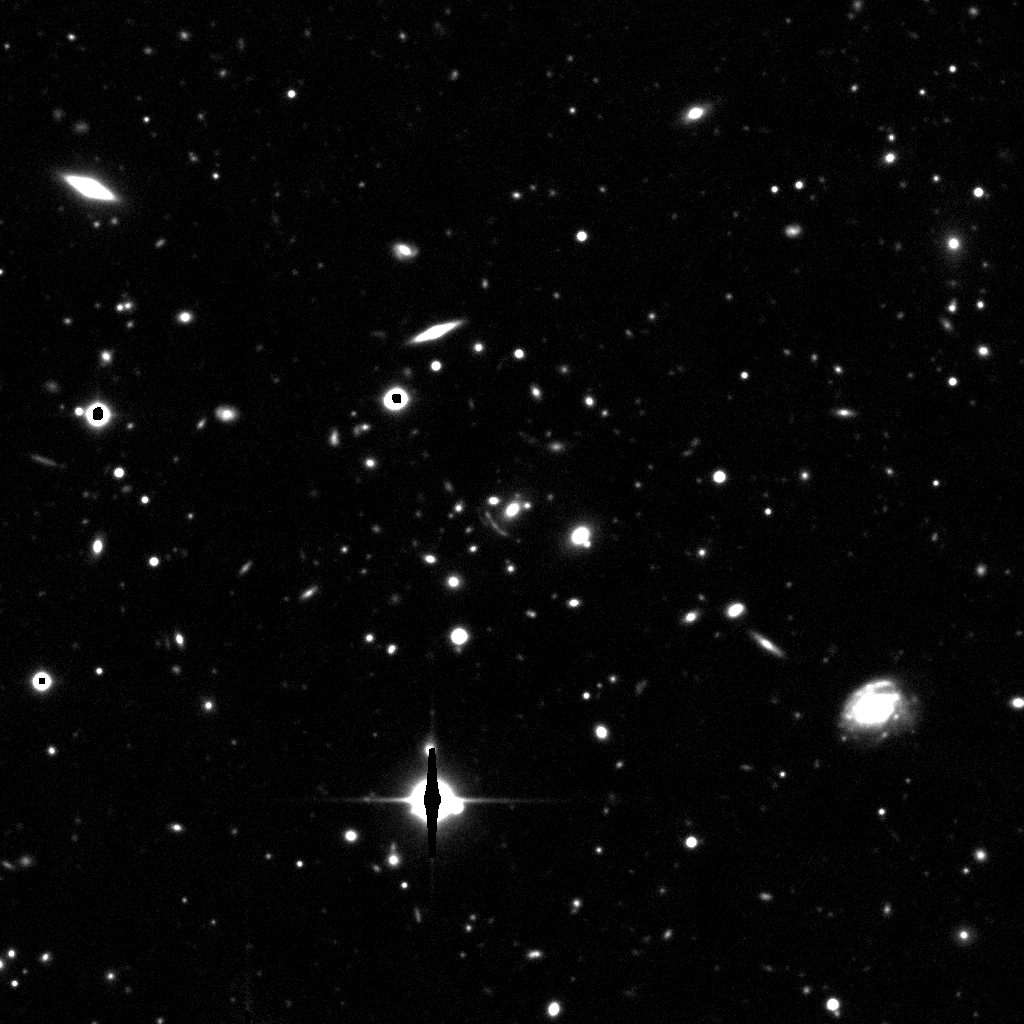
After denoising and deblending all astronomical objects in a gray-scale image obtained by a telescope observation, the resulting intensity distribution of each object can be thresholded at the lowest threshold that clearly delineates the boundary of the object, as shown in the following example cut-out of a recent ground-based sky survey.
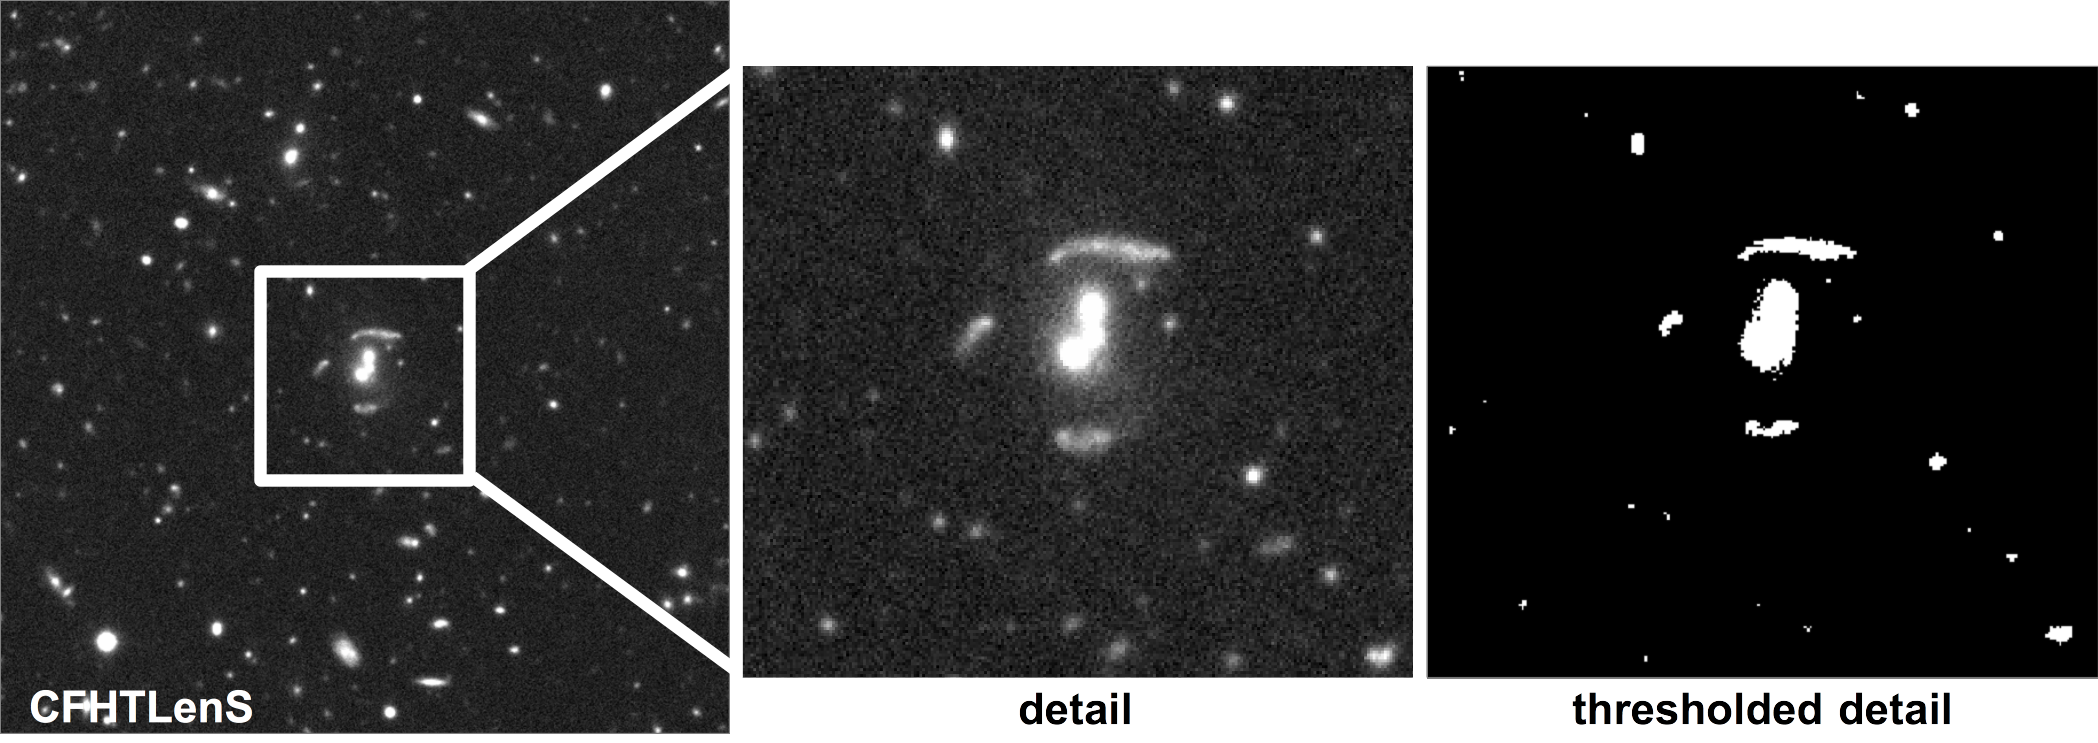
Subsequently performing an anisotropy analysis, we are able to classify the objects and thereby identify them as stars or certain types of galaxies.
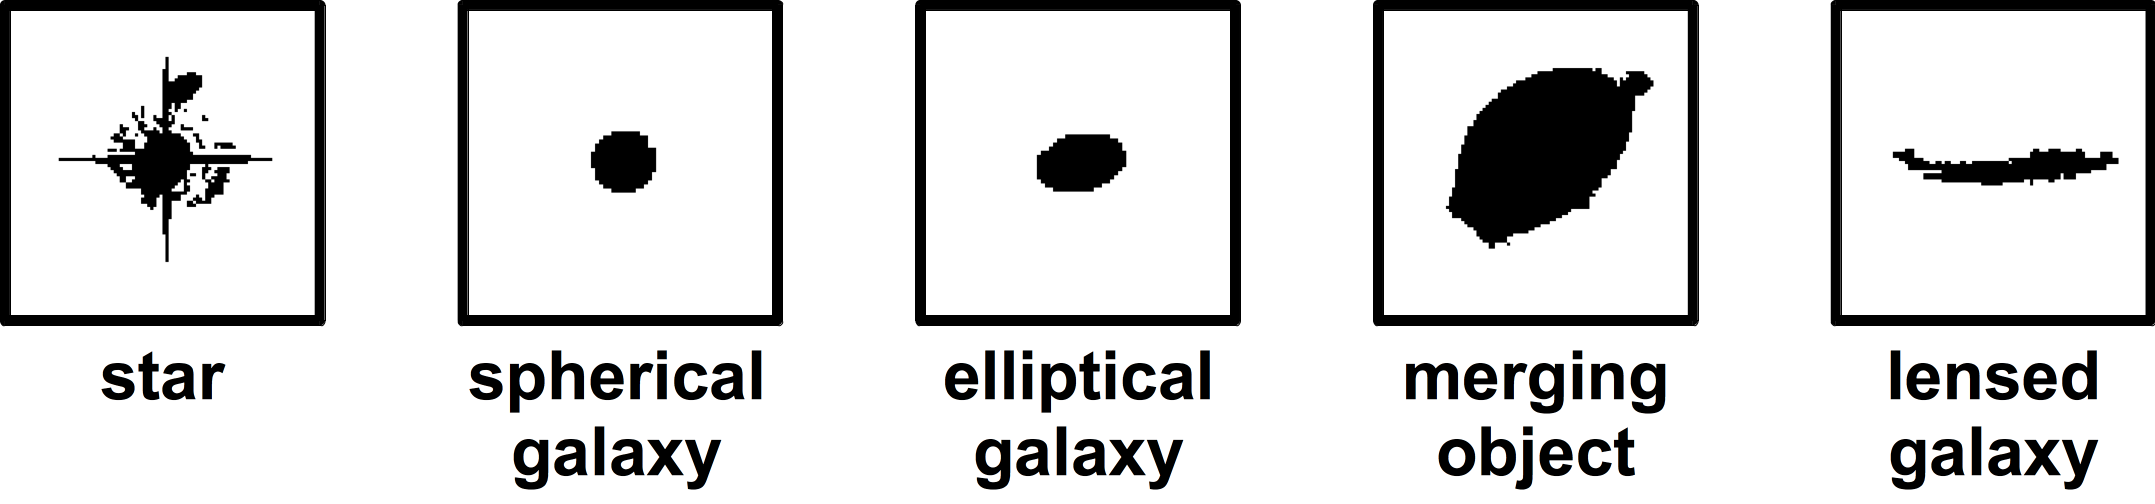
For optical wavelength observations, stars often show spiky data acquisition artefacts when observed. Elliptical galaxies can have a very relaxed, spherical shape, or be of prolate or oblate morphology. In addition, imperfect denoising and incomplete deblending may leave merging objects of unidentifiable class and amorphous shape. Some galaxies at large distances from us can also be subject to the gravitational lensing effect. This effect is caused by a light-deflecting galaxy or an entire cluster of galaxies between the light-emitting source and us as observers. The observed shapes of the background galaxies after passing a gravitational lens are often distorted into banana-like morphologies.
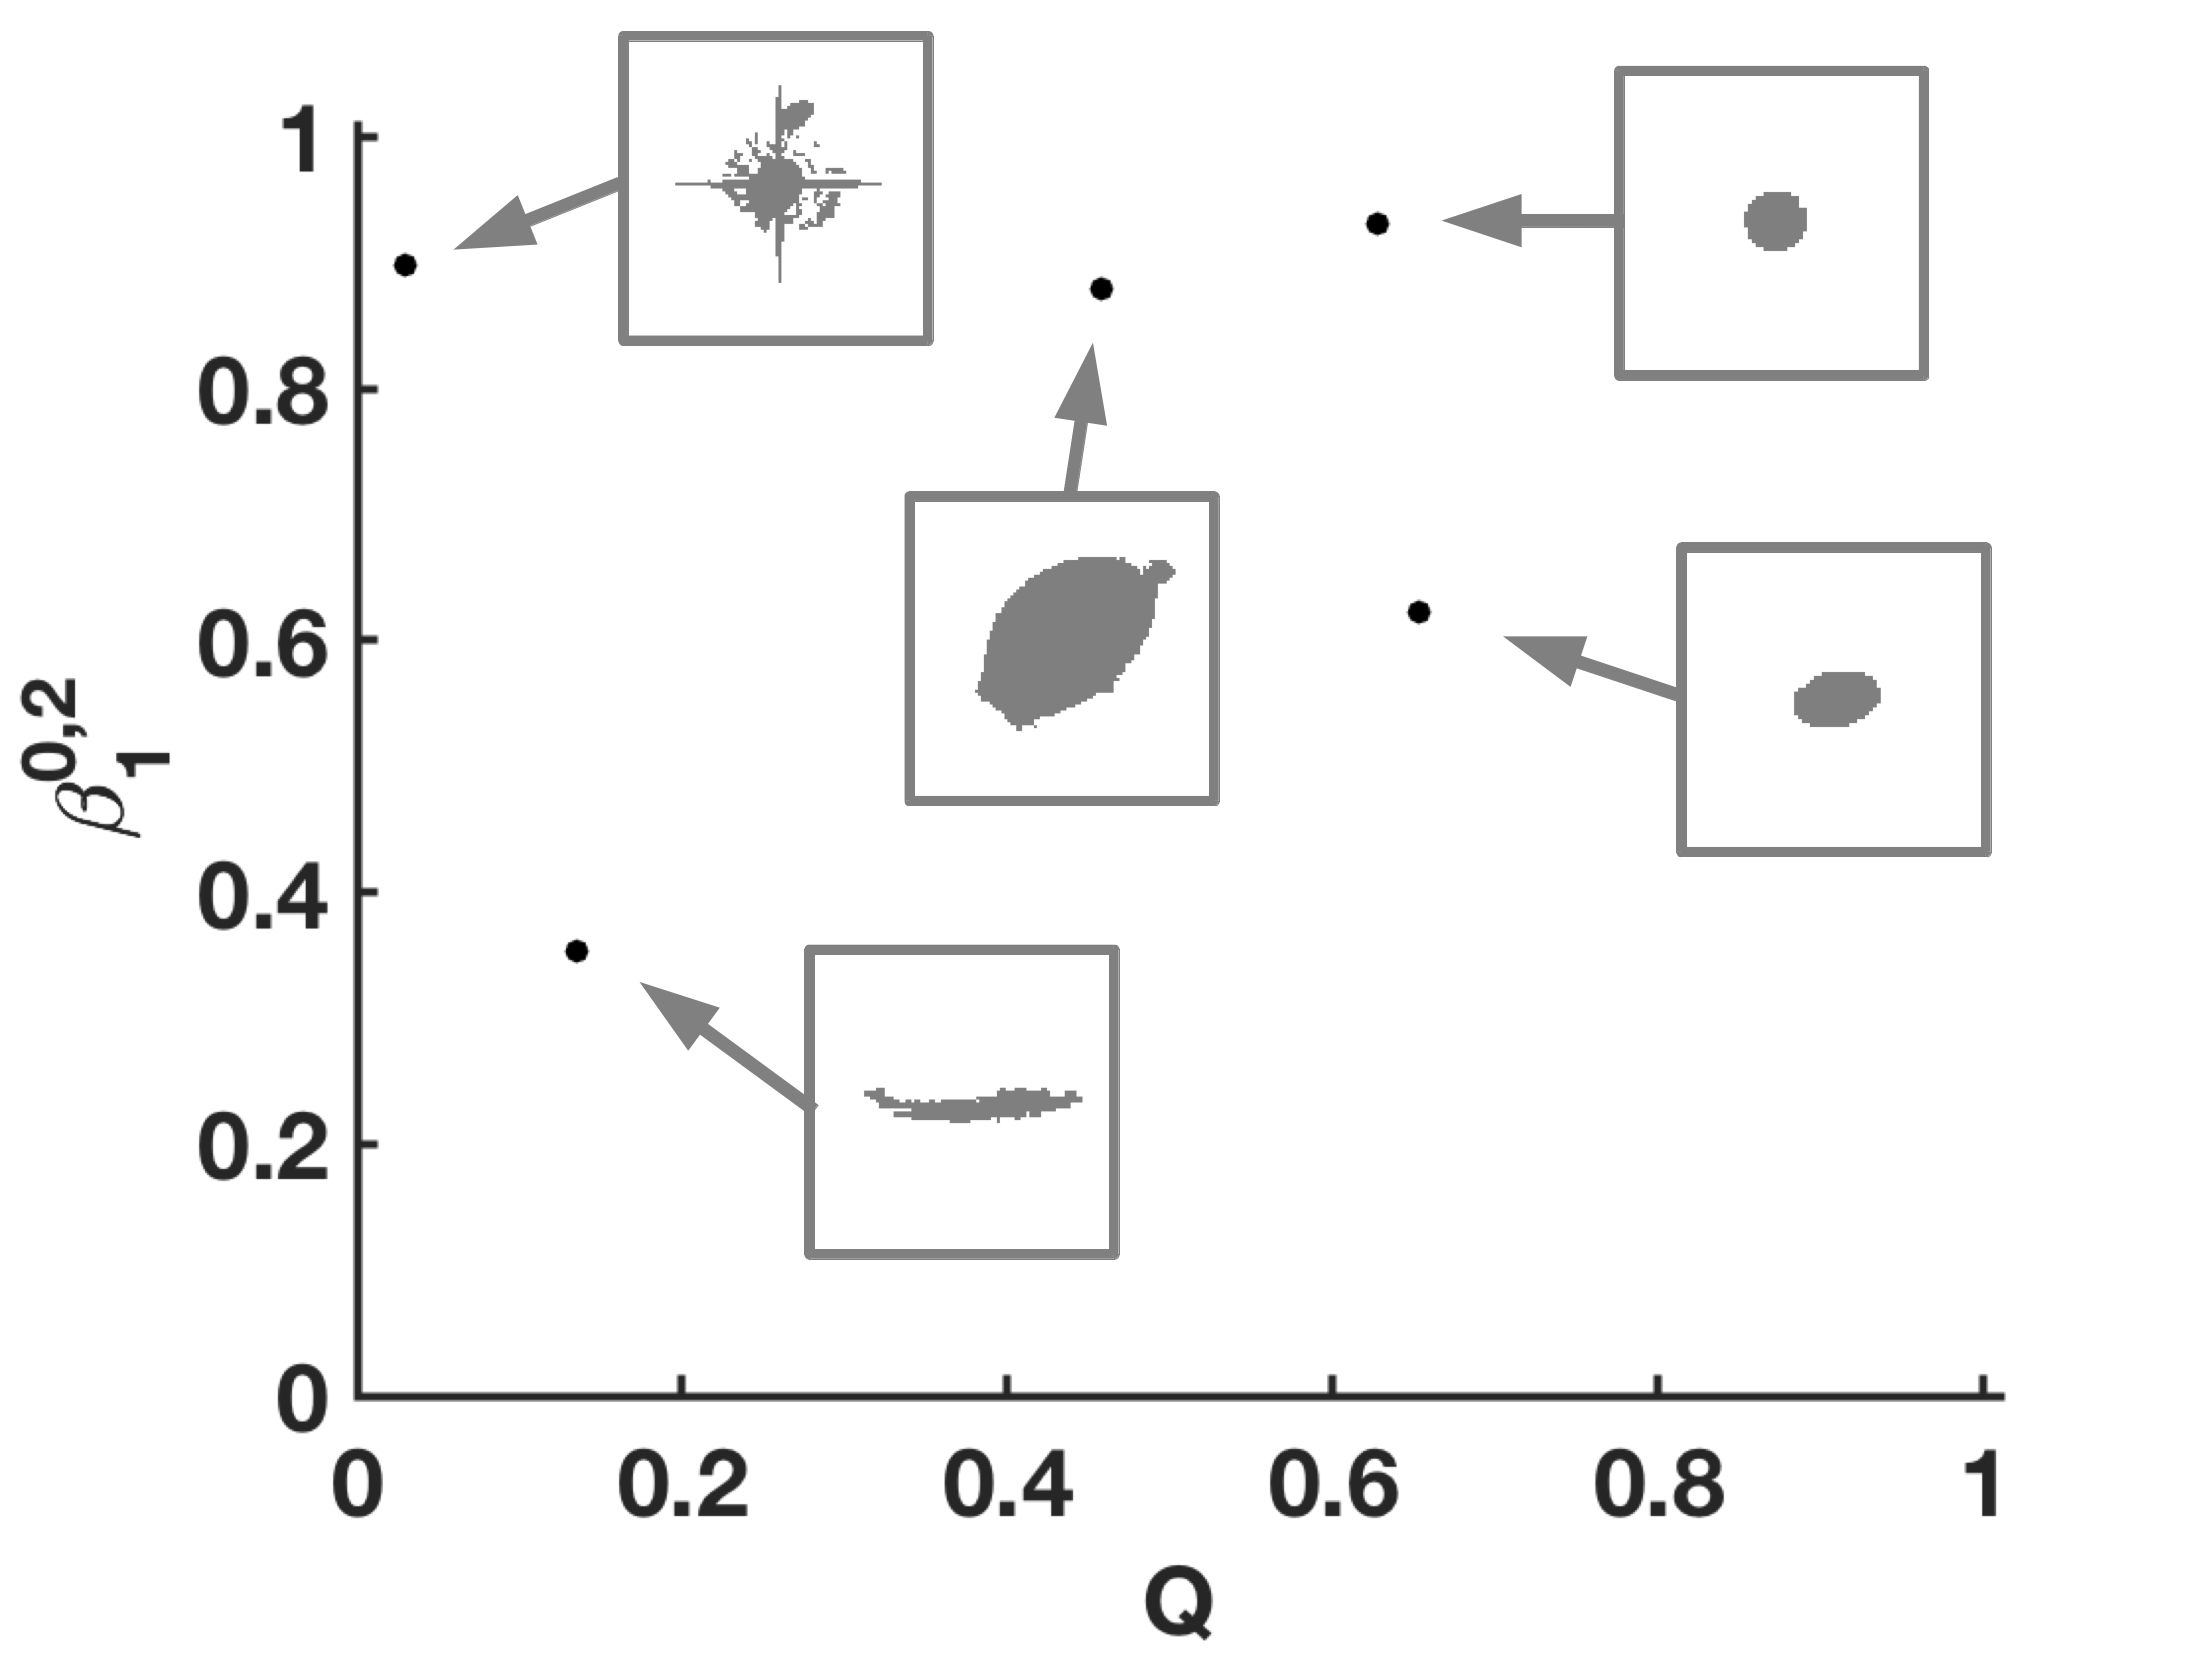
For each of these object types, we choose a thresholded example object from the ground-based Canada-France Hawaii Telescope Lensing Survey, as shown in these boxes:
An anisotropy analysis for each of these objects yields the following graph of the isoperimetric ratio  versus
  , which easily allows us to separate the star from a gravitationally lensed banana-shape object and the elliptical galaxies. The latter are difficult to distinguish from the amorphous merging structure:
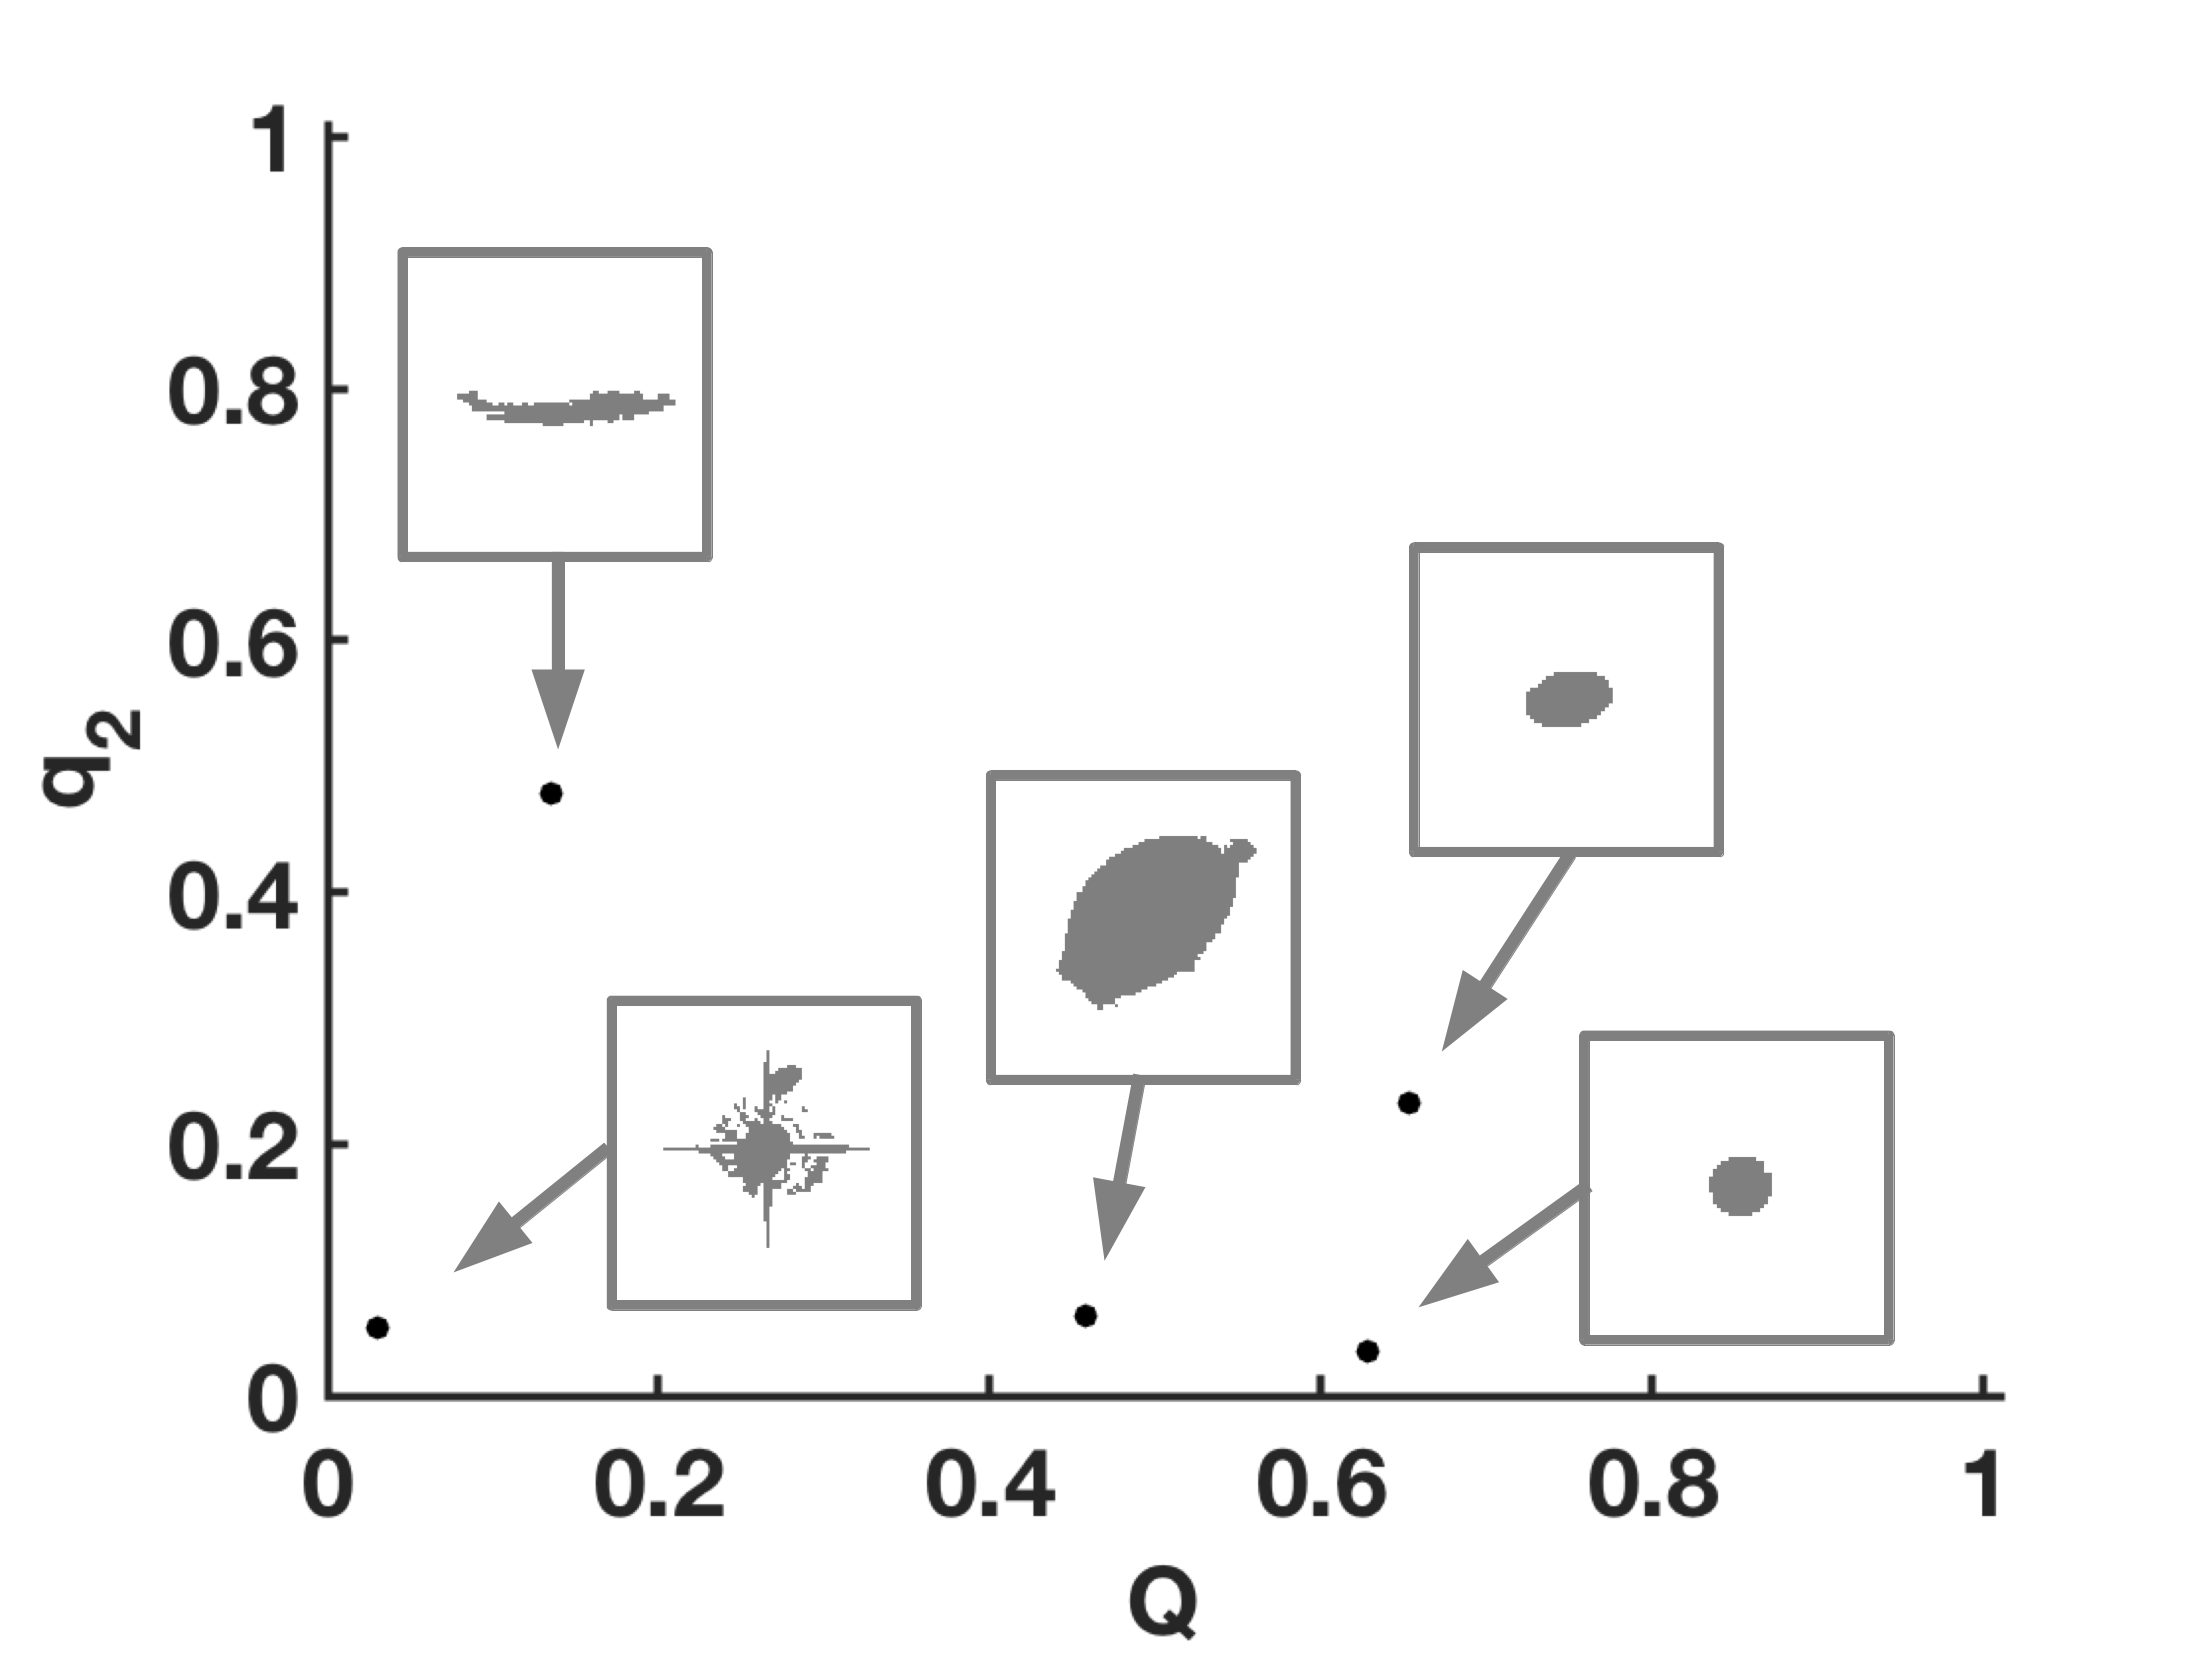
Converting to the ratio of eigenvalues  yields a similar graph, in which the objects are even better separable because their distances with respect to each other are larger due to the (non-linear) transformation between and . The general trend of “boxiness” versus “sphericity” as also shown in this plot is recovered for these astronomical objects.
You can try to classify astronomical objects in another CFHTLenS observation around the galaxy group J14300+5546 by clicking on the button next to the image. A list of already known objects around J14300+5546 can be found here, where a plot of the relative location is also provided.

Example 2: Characterisation of galaxy intensity profiles by Minkowski shape metrics
The intensity distributions of galaxies projected on the celestial sphere reveal valuable information about their stellar constituents, evolution history, and further properties. Identifying the type of a galaxy by the shape of its intensity isocontours therefore is of great interest in astronomy. Cartesian Minkowski Tensors were already successfully employed to categorise galaxies, as detailed in [bibcite key=rahman2003measuring] and [bibcite key=rahman2004measuring], after [bibcite key=beisbart2002vector] had already used the same approach to probe the inner structure of spiral galaxies.
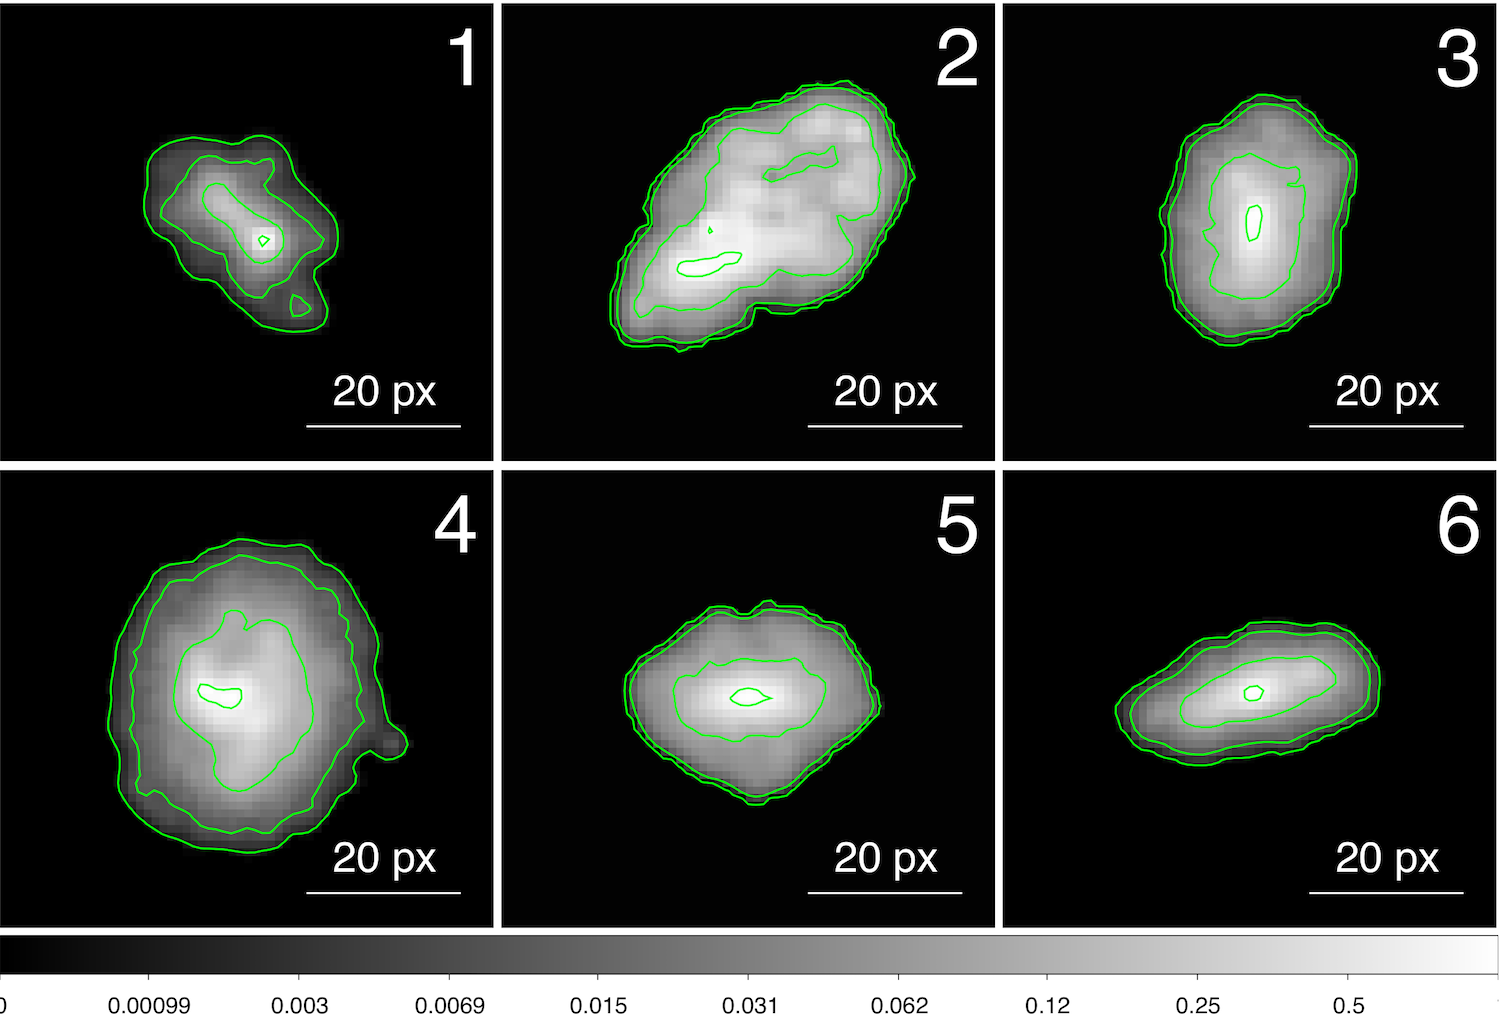
The following picture shows six randomly chosen, denoised galaxies (kindly provided by M. Meneghetti). The green lines on top of the intensity profiles mark the lowest excursion sets.
Performing a Minkowski structure metrics analysis for these six galaxies for excursion sets with increasing intensity threshold  , we obtain the following plots for versus (left) and
  versus (right):
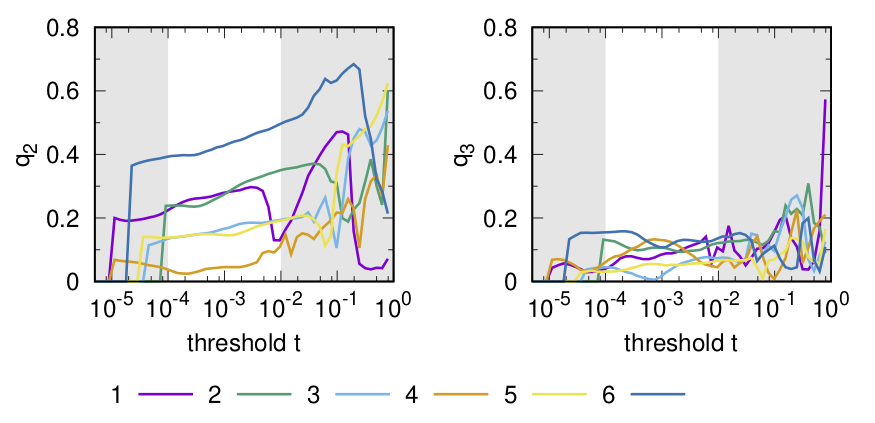
Visually comparing the shapes of the galaxies with their – and -values, it is obvious that can be related to the ellipticity of the excursion set shapes. The galaxies have very little intrinsic moment, implying that triangular morphologies are suppressed. Excursion sets in the grey areas are uninformative because they comprise too few pixels, or become sensitive to remaining noise.
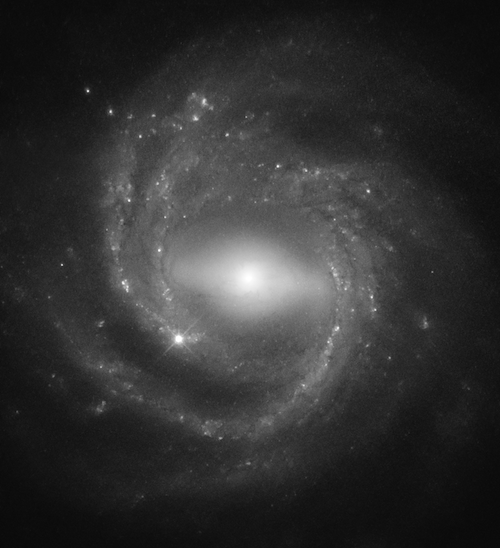
If you want to explore galaxy intensity profiles, you can perform Minkowski structure metrics analyses on a gray-scale image of barred spiral galaxy called NGC 7773 by clicking on the button next to the picture of the galaxy below.

Example 3: Characterisation of gravitational lenses by Minkowski shape metrics
It was shown in [bibcite key=wagner2019model-independent] that analysing the shapes of intensity profiles of background galaxies that were distorted by the gravitational lensing effect can characterise the local distorting properties of the gravitational lens. As gravitational lenses on galaxy and galaxy-cluster scale mostly consist of dark matter, this analysis allows us to probe the dark matter distributions which, so far, have not been successfully detected by direct measurements.
Usually, the intensity profiles of gravitationally lensed background galaxies are expanded in intensity multipoles to infer the local gravitational lens properties. Alternatively, the intensity profiles can be analysed with the Minkowski structure metrics.
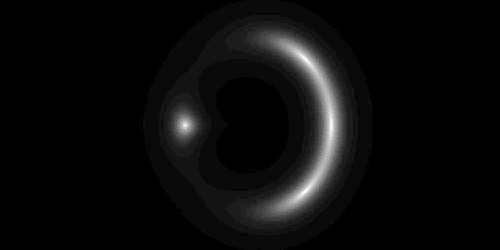
As an example, we perform this analysis for the two distorted intensity profiles that a gravitational lens with a Navarro-Frenk-White mass density profile generates closest to its mass centre out of an axisymmetric Sérsic intensity profile as background source. In this example, the source is axisymmetric, such that any shape distortion can be directly attributed to the gravitational lensing effect.
The following picture shows the two distorted intensity profiles, dubbed “A” and “B” in a normalised gray-scale image, alongside with the horizontal and vertical intensity distributions through the point marked by the red dot. (The point marked by the red cross is the centre of the mass density profile.)
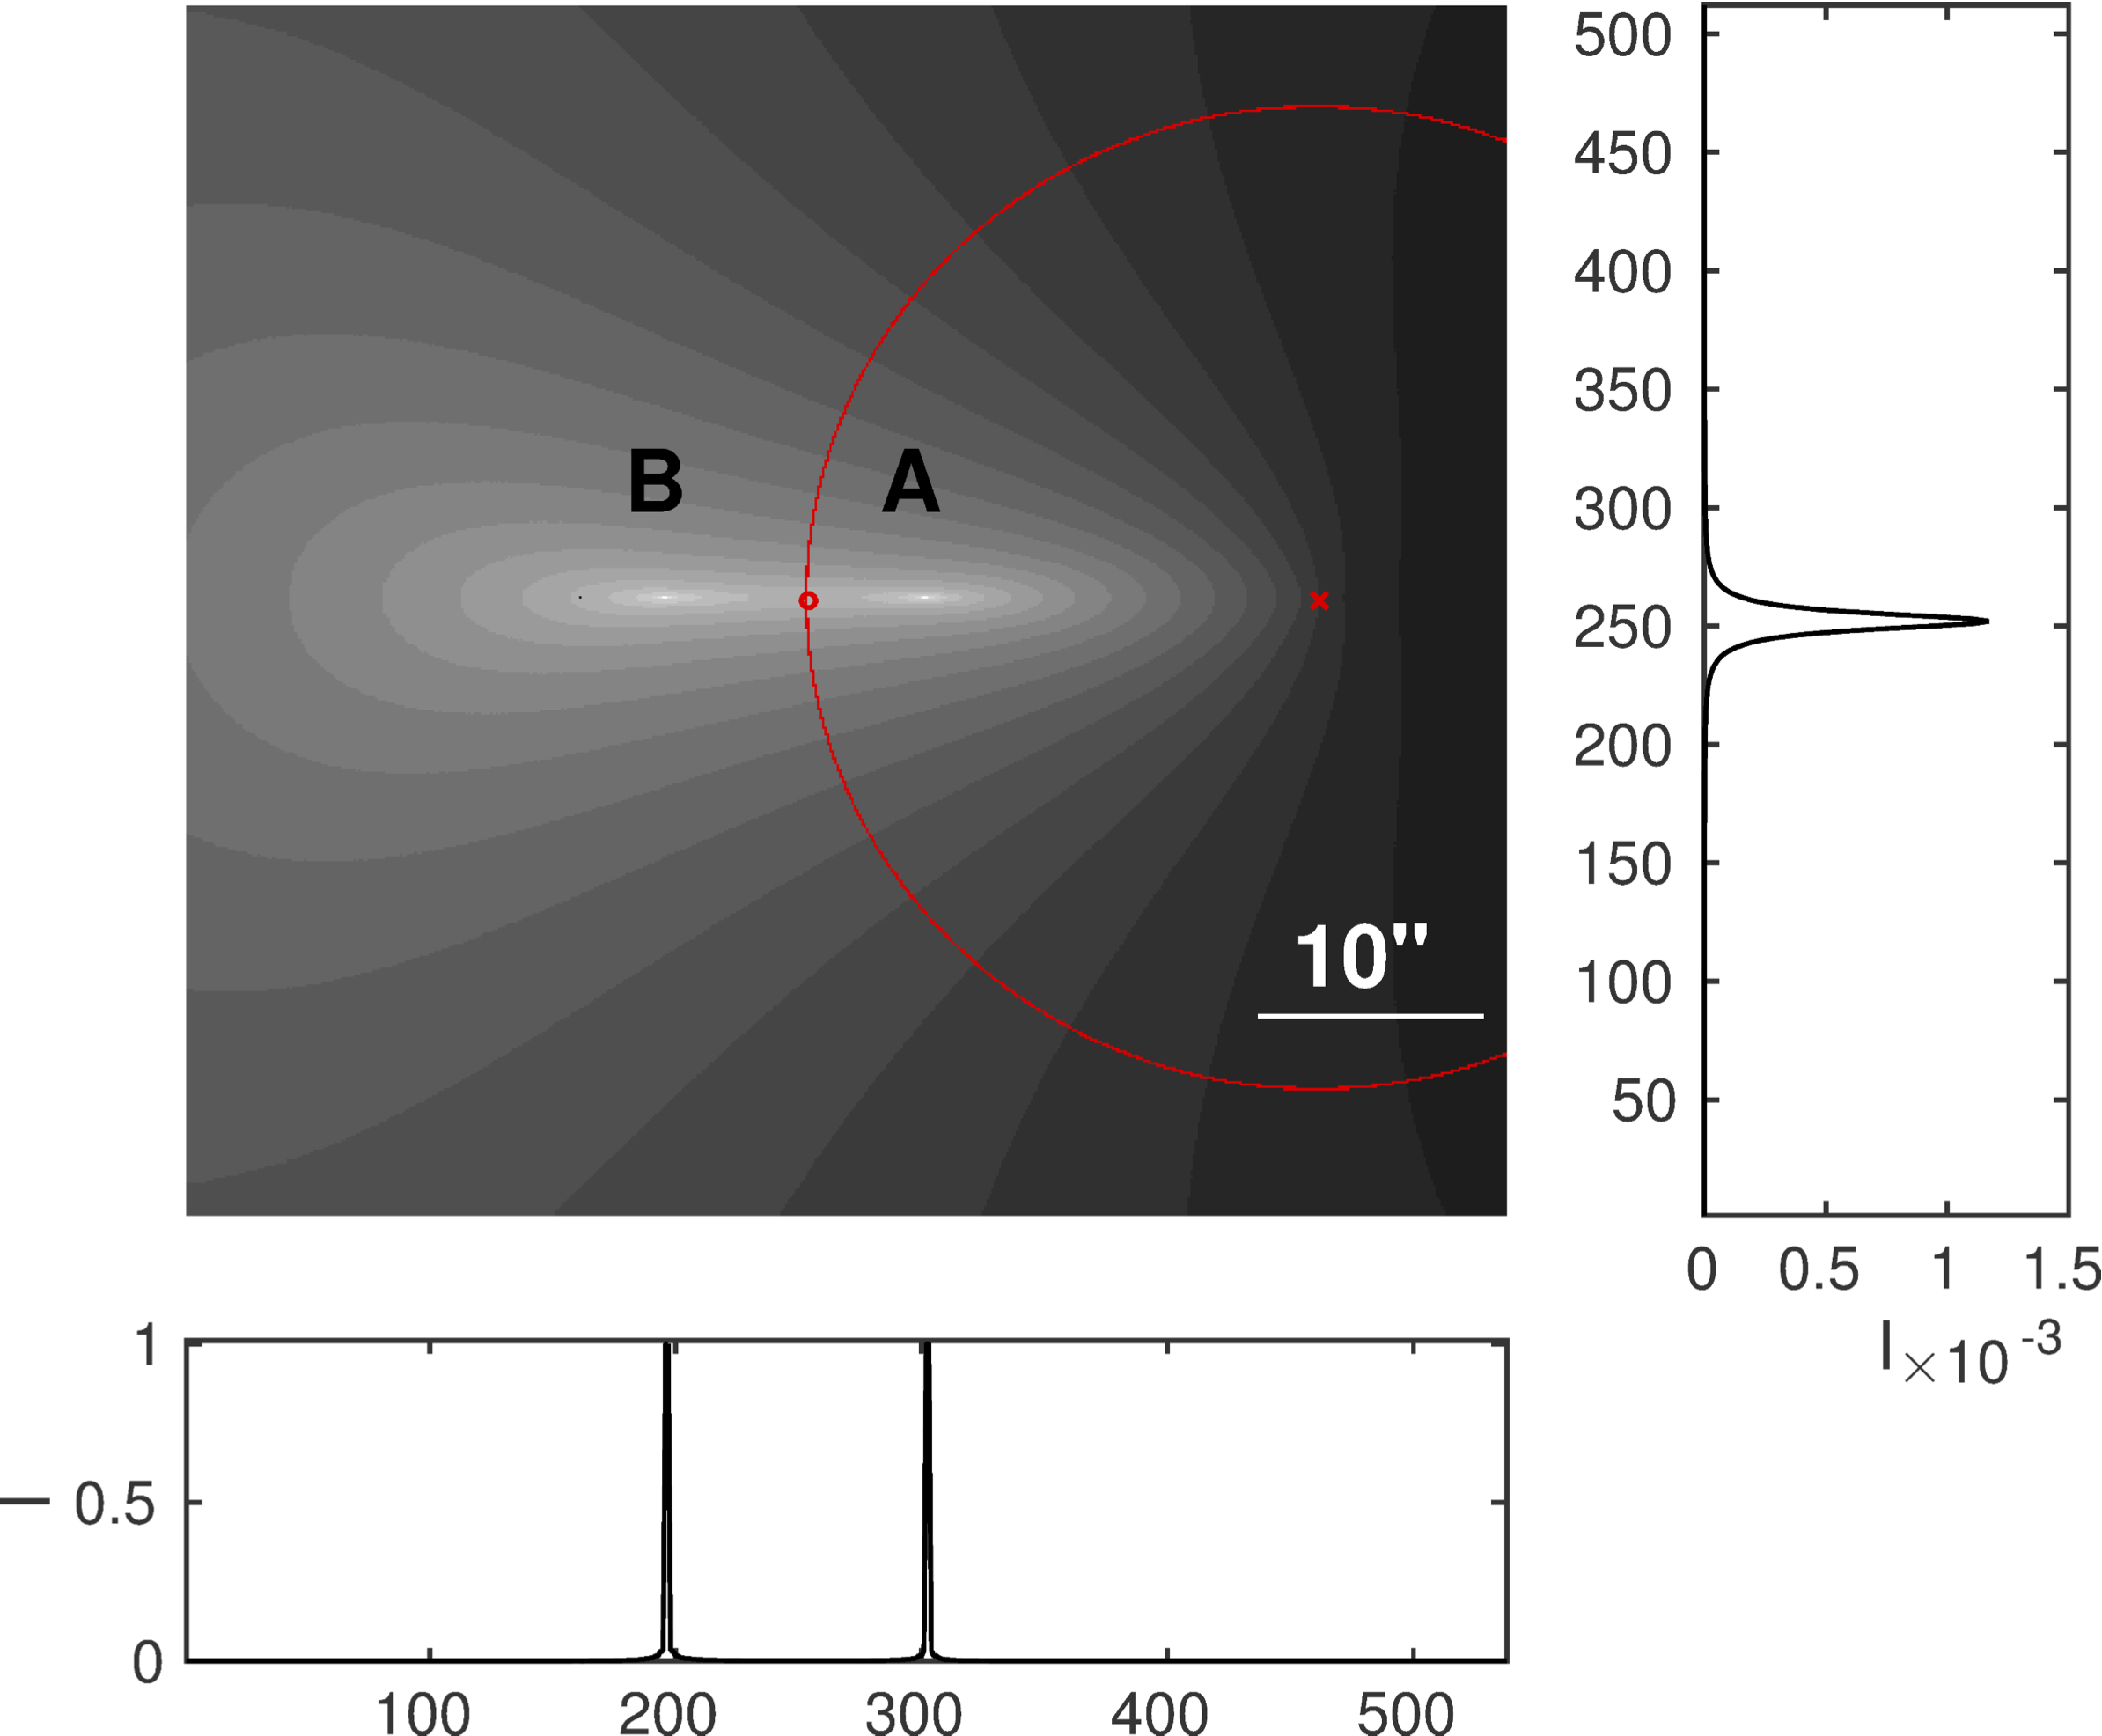
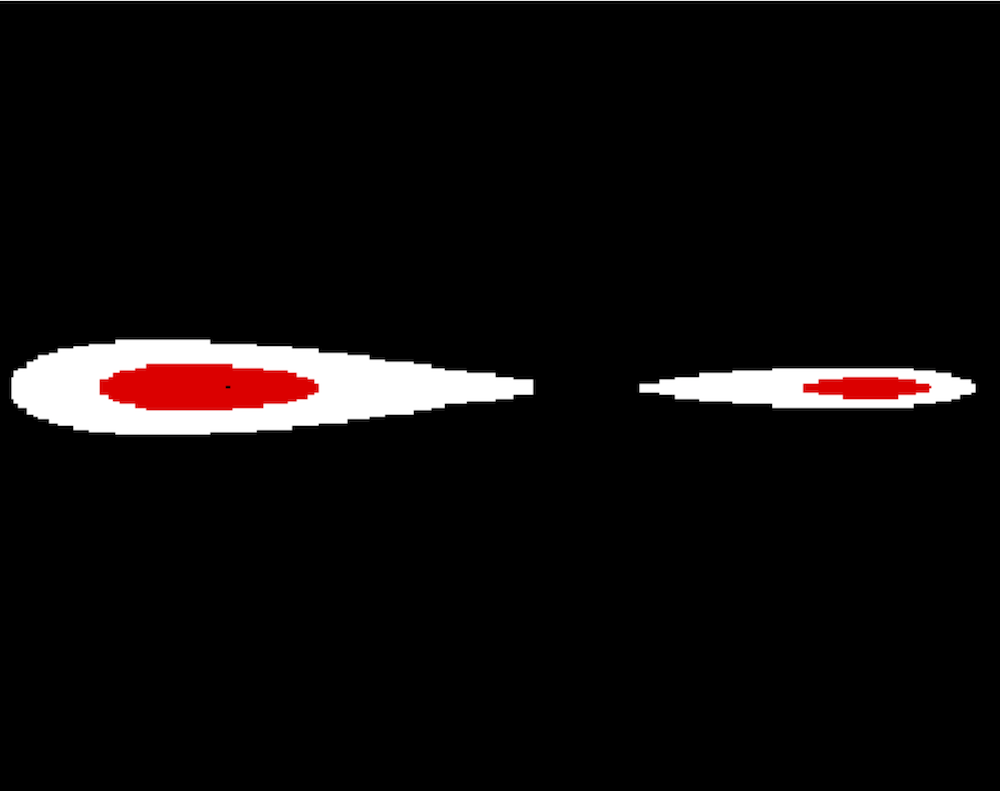
Thresholding the intensity profiles at increasing gray value levels, as shown in the next picture for two example thresholds (left), we can perform a Minkowski structure analysis for the excursion sets of each gray-value threshold, which reveals changing details of the intensity distribution. Since image “A” has too few pixels to be thorougly analysed, we focus on image “B”. Here, we use distance of the normalised Minkowski Vectors  to detect any deviation of the intensity profile from an elliptical shape, as introduced in [bibcite key=beisbart2002vector]. For comparison, we also calculate the analogue distance between the multipoles from the gray-scale image: the distance between the centre of light and the position of maximum intensity. The next picture (right) shows these distances for the Minkowski Vectors (red line) and for the multipoles (black line). These distances represent detectable deviations from ellipticity.
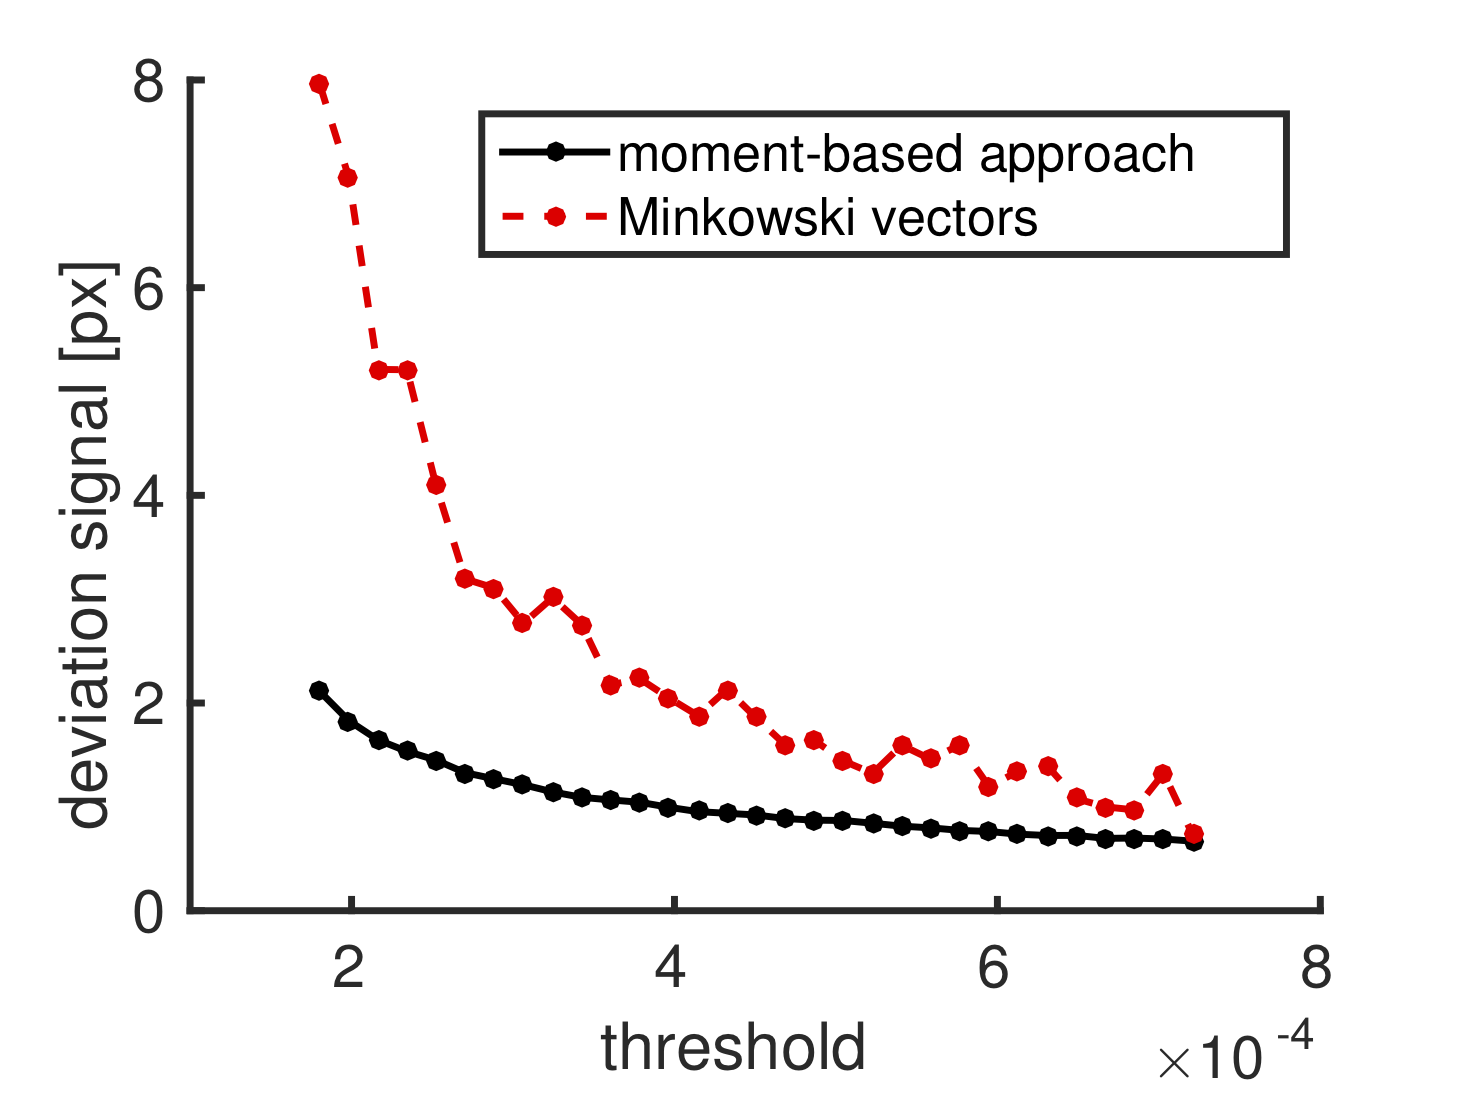
For the axisymmetric source profile, the ellipticity constrains the leading-order local gravitational lens properties. Thus, the plot reveals that this Minkowski structure metrics analysis is able to extract higher-order features from the distorted galaxy intensity profiles than its multipole analogue. Consequently, Minkowski structure metrics analyses are better suited as shape descriptors for these distorted galaxy intensity profiles to characterise local gravitational lens properties to greater detail.
If you want to perform a Minkowski structure metrics analysis on an axisymmetric Sérsic profile that is distorted by a singular isothermal ellipse as gravitational lens, try it out by clicking on the button below. The singular isothermal elliptical mass density profile can be obtained from the singular isothermal sphere by replacing the constant radius  by an angle-dependent radius
  .
.