Here we show how to employ Minkowski structure metrics to detect order in particle configurations.
Lennard-Jones-Gauß potentials are known to form decagonal quasicrystals in 2D [bibcite key=engel2007self-assembly]. These structures produce a scattering pattern much like normal crystals do, but are aperiodic (i.e. there is no repeating unit cell which generates the crystal by translation). In quasicrystals, non-crystallographic rotational symmetries are possible, like 10-fold axes in the example shown below. Given the ten-fold symmetry of the structures, all neighbors of a particle are located at multiples 360/10 = 36 degrees with respect to some given axis. Thus, in this quasicrystal, all the Voronoi cell’s normals point in these directions, which is why  for all these!
In the following image, each cell is colored according to its  magnitude, with being red and
  being blue.
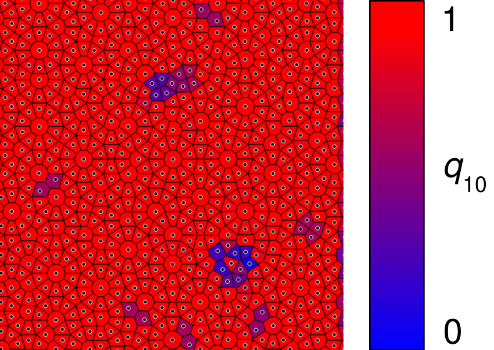
This snapshot is taken from a simulation at finite temperature [bibcite key=martinsons2019event-chain-qc], and thus has some defects in it, which appear as cells with  (tinted blue).
The Voronoi diagram of the quasicrystal structure is richer than one of a conventional crystal. It contains various polygons, the most frequent of which are regular decagons, octagonal “cap tiles”, hexagonal “axe tiles” and “diamonds”, and trapezoids of specific shape. Any cell shape can be characterized using Minkowski structure metrics. The same configuration, with the  and
and  glasses on, looks like this:
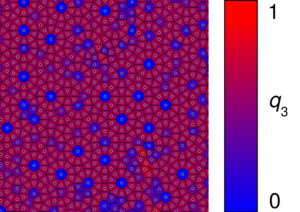
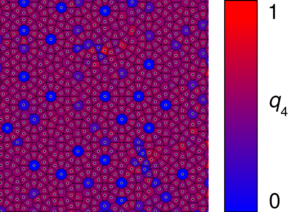
Clearly, the decagons have  , while the other tiles each have some specific and .
Several Minkowski structure metrics taken together can be used to fingerprint a given cell shape. For reference, we include the circle below, which has  for all
  . The quasicrystal tiles have the following characteristic
  values:
 |
|
|
 |
 |
 |
 |
 |
|
|
| Circle | 0.0000 | 0.0000 | 0.0000 | 0.0000 | 0.0000 | 0.0000 | 0.0000 | 0.0000 | 0.0000 |
| Decagon | 0.0000 | 0.0000 | 0.0000 | 0.0000 | 0.0000 | 0.0000 | 0.0000 | 0.0000 | 1.0000 |
| Diamond | 0.0669 | 0.4605 | 0.5669 | 0.0000 | 0.5669 | 0.4605 | 0.0669 | 0.0000 | 1.0000 |
| Trapezoid | 0.0698 | 0.6612 | 0.5914 | 0.4086 | 0.5914 | 0.6612 | 0.0698 | 0.0000 | 1.0000 |
| Cap tile | 0.1040 | 0.2325 | 0.3365 | 0.3762 | 0.3365 | 0.2325 | 0.1040 | 0.0000 | 1.0000 |
| Axe tile | 0.1752 | 0.3917 | 0.2165 | 0.7835 | 0.2165 | 0.3917 | 0.1752 | 0.0000 | 1.0000 |
If we plot the vs. the value of each cell in a scatterplot, the typical cell types expected in a perfect decagonal quasicrystal can be readily identified:
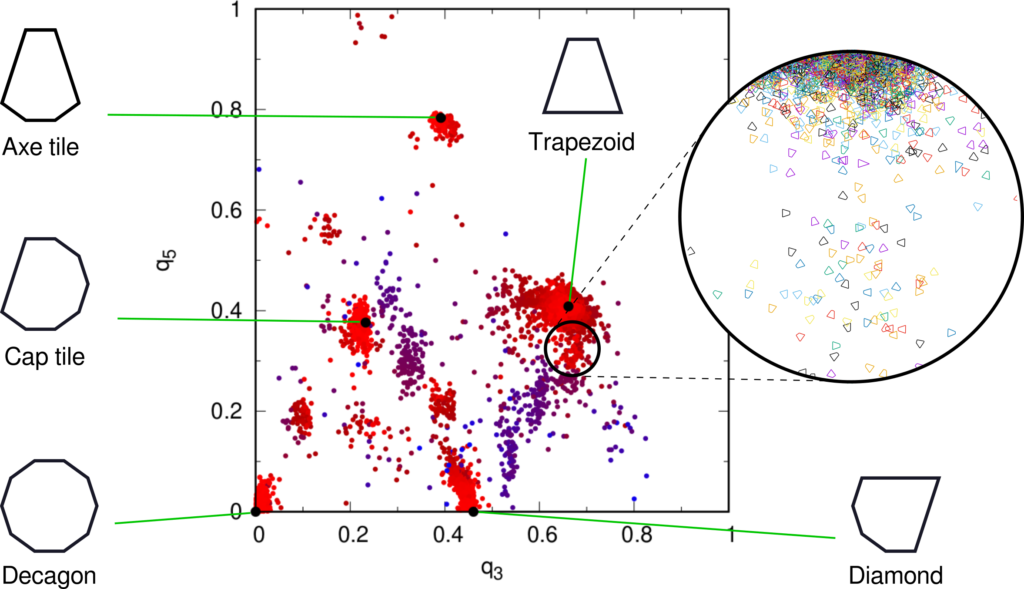
The colour code shows again. Each of the five tile types listed above has  in its ideal configuration, identified by a black solid bullet. Around those, we find tiles which are slightly perturbed by thermal noise (still red in color as their
  ). The farther the tiles are located from the ideal cell shape in this plot, the more deformed they are.
Datapoints far away from the bullets in bluish colour are defects which do not conform to the quasicrystal symmetry. These include the pentagonal tiles ( ) and quadrilateral kites (
 ,
,  ) which were already apparent as blue-tinted defects in Figure 1.